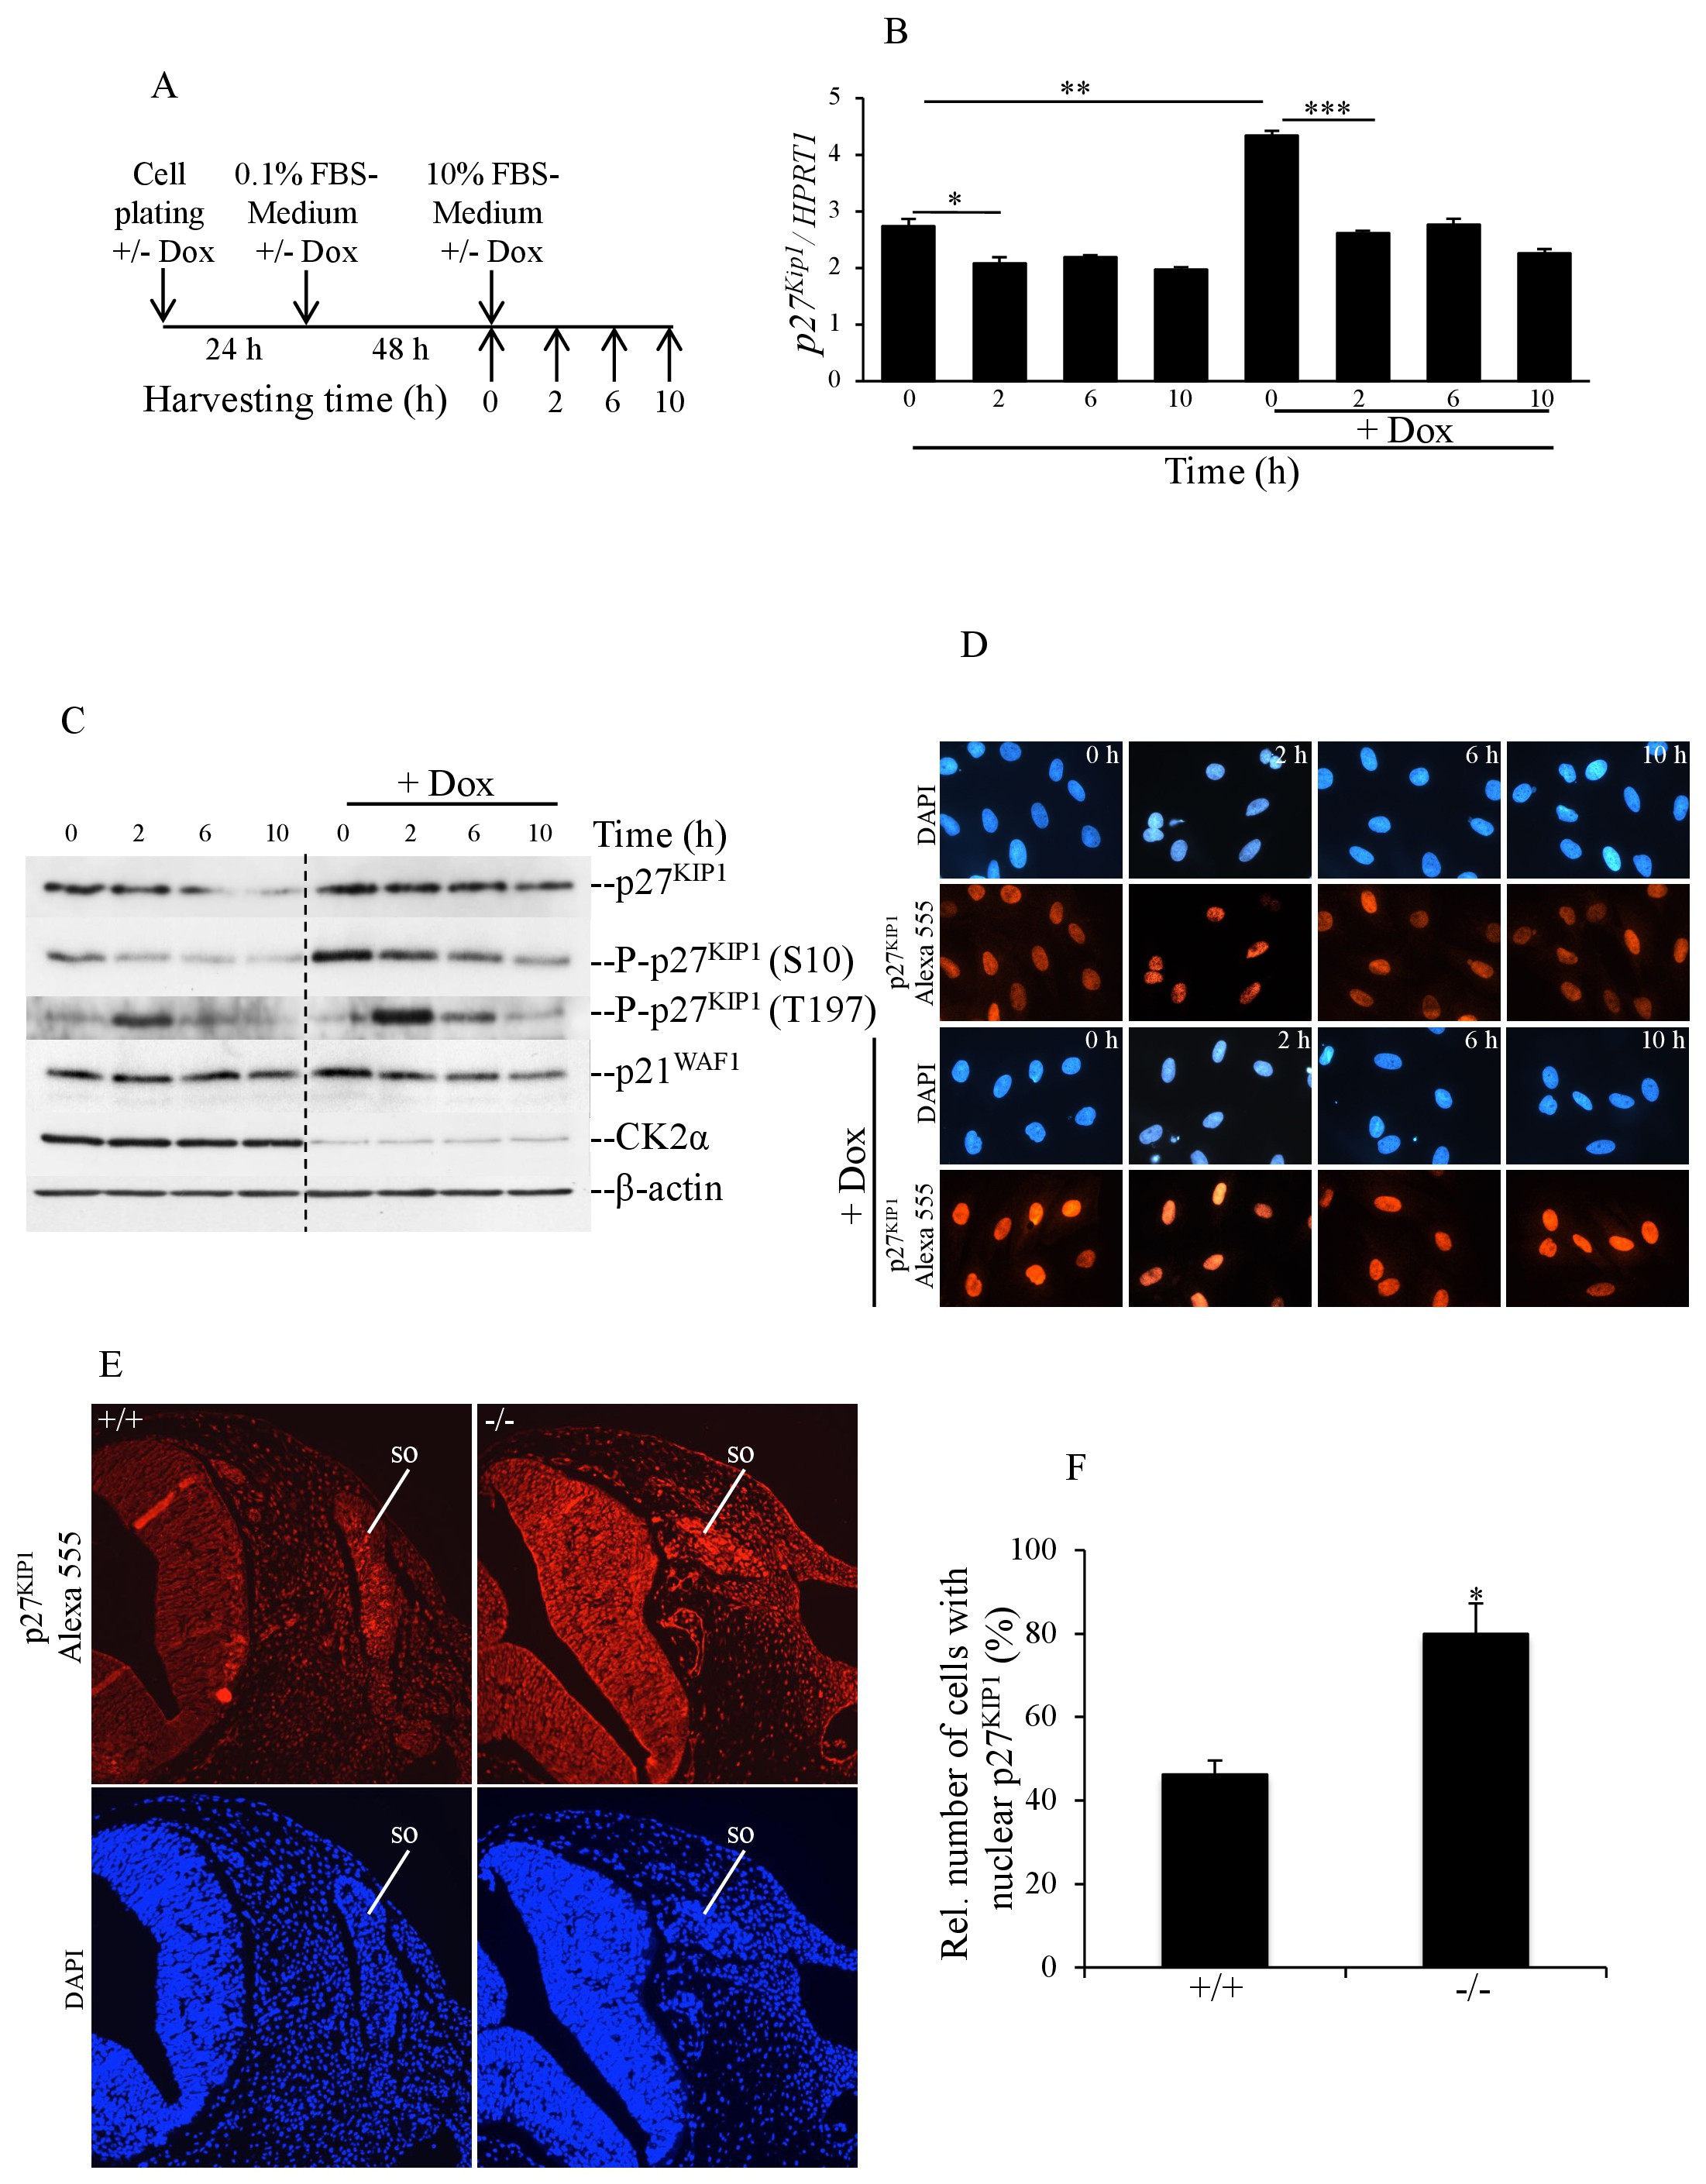
Fig. 5. Delayed G1/S cell cycle transition is accompanied by up-regulation of p27KIP1 in myoblasts depleted of CK2α and in CK2α-KO mouse embryos. (A) Cells were synchronized by serum starvation in the presence or absence of doxycycline for 48 hours and harvested at the indicated time points after adding full growth medium. (B) Total RNA was isolated and used for reverse transcription quantitative PCR (RT-qPCR). Graph shows the ratio p27KIP1/HPRT1 mRNA. Data are the average of three independent experiments +/- standard error of the mean (SEM). *P = 0.02, **P = 0.0031, ***P = 0.004. (C) Whole lysate from cells treated as described in (A) were analyzed by western blot employing antibodies against the indicated proteins. (D) Immunostaining of cells with rabbit polyclonal anti-p27KIP1 and subsequently, a biotin-conjugated secondary anti-rabbit IgG antibody. Expression and localization of p27KIP1 was revealed by cell staining with Alexa Fluor 555-conjugated streptavidin. Cell nuclei were visualized by DAPI staining. Cell pictures were taken at 40x magnification. (E) p27KIP1 staining of tissue sections from wild-type (+/+) and knockout (-/-) mouse embryos at E10.5, respectively. Photographs were taken at 20x magnification. Fluorescence pictures were pseudo-colored and show p27KIP1 nuclear staining (red). Cell nuclei were visualized as in (D). (F) Bar-graph showing in percentage the ratio of p27KIP1-positive cells/total number of cells in the embryos. Three to five sections each from three pairs of wild-type and knockout embryos were analyzed. Values are mean +/- STDEV, *P<0.0005. SO: somite.